Create and use analytics reports with Power BI
Get started building with Power BI
Introduction :- Power BI is a business analytics service by Microsoft. It aims to provide interactive visualizations and business intelligence capabilities with an interface simple enough for end users to create their own reports and dashboards.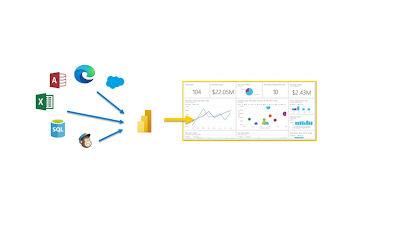
The parts of Power BI :-
Power BI consists of a Microsoft Windows desktop application called Power BI Desktop, an online SaaS (Software as a Service) service called the Power BI service, and mobile Power BI apps that are available on any device, with native mobile BI apps for Windows, iOS, and Android.

The flow of work in Power BI :- A common flow of work in Power BI begins in Power BI Desktop, where a report is created. That report is then published to the Power BI service and finally shared, so that users of Power BI Mobile apps can consume the information.
Use Power BI :-The activities and analyses that you'll learn with Power BI generally follow a common flow. The common flow of activity looks like this:- Bring data into Power BI Desktop, and create a report.
- Publish to the Power BI service, where you can create new visualizations or build dashboards.
- Share dashboards with others, especially people who are on the go.
- View and interact with shared dashboards and reports in Power BI Mobile apps.

Building blocks of Power BI :- The Building blocks in power BI are nothing but the components of Power BI, There are 5 components of Power BI - Visualizations
- Datasets
- Reports
- Dashboard
- Tiles
Visualizations :-A visualization is also known as visual, & Visualization is nothing but the visual representation of data. Like a chart, a color-coded map, or other interesting things you can create to represent your data visually.

Datasets :-A Dataset is a collection of data that Power BI uses to create visualizations. Also datasets can be combination of multiple different sources which you can combine to provide a unique collection of data (a dataset) for use in Power BI.

Reports :-
In Power BI, a report is a collection of visualizations that appear together on one or more pages. Reports lets you create many visualizations on single or multiple pages & lets you arrange those visualization in the way you want.

Dashboard :-
Power BI dashboard is a collection of visuals from a single page that you can share with others. Dashboard are also called as canvas.
Tiles :-In Power BI, a tile is a single visualization on a dashboard. It's the rectangular box that holds an individual visual.

Tour and use of Power BI Services :-The common flow of work in Microsoft Power BI is to create a report in Power BI Desktop, publish it to the Power BI service, and then share it with others, so that they can view it in the service or on a mobile app.
Create out-of-box dashboard with cloud services :-With Power BI connecting to data is easy. From Power BI service, You can just select get data (as show in image) button to get data from the data source.

There are common sources like Excel Files, Databases, or Microsoft Azure data, Power BI can easily connect to a whole assortment of services like Salesforce, Facebook, Google Analytics & many more. For these software services, the Power BI service provides a collection of ready-made visuals that are pre-arranged on dashboards and reports for your organization.

For example, we will chose GitHub from the apps shown in above image, after clicking on GitHub to connect once you do that a dialog box will appear

Enter your credentials to login in to your GitHub account, once you enter the credentials and click on next your app installation will begin.

After the data is loaded, the predefined GitHub app dashboard appears as shown in image below.

This is how you will Install Power BI Apps.
Get started building with Power BI
Introduction :-
Power BI is a business analytics service by Microsoft. It aims to provide interactive visualizations and business intelligence capabilities with an interface simple enough for end users to create their own reports and dashboards.

The parts of Power BI :-
Power BI consists of a Microsoft Windows desktop application called Power BI Desktop, an online SaaS (Software as a Service) service called the Power BI service, and mobile Power BI apps that are available on any device, with native mobile BI apps for Windows, iOS, and Android.

The flow of work in Power BI :-
A common flow of work in Power BI begins in Power BI Desktop, where a report is created. That report is then published to the Power BI service and finally shared, so that users of Power BI Mobile apps can consume the information.
Use Power BI :-
The activities and analyses that you'll learn with Power BI generally follow a common flow. The common flow of activity looks like this:
- Bring data into Power BI Desktop, and create a report.
- Publish to the Power BI service, where you can create new visualizations or build dashboards.
- Share dashboards with others, especially people who are on the go.
- View and interact with shared dashboards and reports in Power BI Mobile apps.
Building blocks of Power BI :-
The Building blocks in power BI are nothing but the components of Power BI, There are 5 components of Power BI
- Visualizations
- Datasets
- Reports
- Dashboard
- Tiles
Visualizations :-
A visualization is also known as visual, & Visualization is nothing but the visual representation of data. Like a chart, a color-coded map, or other interesting things you can create to represent your data visually.

A Dataset is a collection of data that Power BI uses to create visualizations. Also datasets can be combination of multiple different sources which you can combine to provide a unique collection of data (a dataset) for use in Power BI.

In Power BI, a report is a collection of visualizations that appear together on one or more pages. Reports lets you create many visualizations on single or multiple pages & lets you arrange those visualization in the way you want.

Power BI dashboard is a collection of visuals from a single page that you can share with others. Dashboard are also called as canvas.
Tiles :-
In Power BI, a tile is a single visualization on a dashboard. It's the rectangular box that holds an individual visual.

Tour and use of Power BI Services :-
The common flow of work in Microsoft Power BI is to create a report in Power BI Desktop, publish it to the Power BI service, and then share it with others, so that they can view it in the service or on a mobile app.
Create out-of-box dashboard with cloud services :-
With Power BI connecting to data is easy. From Power BI service, You can just select get data (as show in image) button to get data from the data source.

There are common sources like Excel Files, Databases, or Microsoft Azure data, Power BI can easily connect to a whole assortment of services like Salesforce, Facebook, Google Analytics & many more. For these software services, the Power BI service provides a collection of ready-made visuals that are pre-arranged on dashboards and reports for your organization.

For example, we will chose GitHub from the apps shown in above image, after clicking on GitHub to connect once you do that a dialog box will appear


After the data is loaded, the predefined GitHub app dashboard appears as shown in image below.

This is how you will Install Power BI Apps.
Comments
Post a Comment